
After demonstrating TQrouting’s performance advantage on CVRP benchmarks, a natural question follows: How does it perform when facing the more complex routing challenges that teams face daily in their operations?
In practice, logistics workflows rarely resemble the simplicity of a classical Capacitated Vehicle Routing Problem (CVRP). Real optimization scenarios require planning around delivery time windows, managing fleets across multiple depots, and selecting which customers to serve when fleets are limited yet profitability is a key decision factor. These challenges are common in parcel delivery, e-grocery logistics, field service operations, and regional distribution. Each additional constraint increases complexity and exposes the limits of traditional solvers.
To evaluate robustness across these real-world conditions, we benchmarked TQrouting on three widely studied VRP variants:
- CVRP-TW (Solomon, Gehring & Homberger): Routing with strict customer time windows, which is essential for parcel delivery, e-grocery, and technician dispatch.
- MD-VRP (Cordeau et al.): Multi-depot operations where vehicles start and end at different hubs, representing regional logistics networks.
- TOP (Chao et al., Dang et al.): Prize-collecting routing for selecting the most profitable customers when time or fleet resources are limited. (e.g., field sales, constrained last-mile delivery).
Each benchmark reflects a core logistics challenge: meeting delivery windows, coordinating multi-depot networks, or maximizing profit with constrained resources. Across all three variants, TQrouting demonstrates strong modularity, adaptability, and high solution quality within short runtimes, illustrating its suitability for fast-moving real-world environments.
Experiment Setup
- Hardware: Google Cloud Platform VM (AMD EPYC 7B13, 16 vCPUs @ 3.05 GHz, 32 GB RAM)
- Solvers tested: TQrouting, Gurobi (v12.0), OR-Tools (v9.12)
- Runtime limit: 1 minute per instance
- Parameters: Default settings, multithreading enabled enabled (allowing solvers to fully leverage parallelism)
- Metric: Relative gap to the best-known solution (BKS) reported in the literature
Results
CVRP-TW (Solomon, Gehring & Homberger)
TQrouting achieves an average gap of 1.68%, outperforming state-of-the-art commercial and open-source solvers.
| Customers | TQrouting | OR-Tools 9.12 | Gurobi 12.0 |
| 100 | 0.00% | 1.74% | 6.73% |
| 200 | 0.12% | 5.50% | 9,45% |
| 400 | 1.00% | 10.92% | 24.78% |
| 600 | 1.95% | 12.94% | 34.89% |
| 800 | 2.94% | 17.70% | 204.57% |
| 1000 | 4.09% | 29.28% | 623.63% |
| Average | 1.68% | 13.01% | 150.67% |
MD-VRP (Cordeau et al.)
TQrouting reaches a near-optimal average gap of 0.022% within 1 minute — far outperforming OR-Tools and Gurobi.
| Dataset | Customers | Depots | TQrouting | OR-Tools 9.12 | Gurobi12.0 |
| p01-p23 | 50–360 | 2-9 | 0.020% | 3.827% | 369.852% |
| pr01–pr10 | 48–288 | 2-12 | 0.026% | 6.670% | 32.511% |
| Average | 0.022% | 4.652% | 339.185% |
TOP (Chao et al., Dang et al.)
TQrouting achieves an average gap of 0.02%, consistently delivering near-optimal solutions.
| Customers | TQrouting | OR-Tools 9.12 | Gurobi 12.0 |
| 64–102 (Chao et al) | 0.02% | 2.51% | 4.62% |
| 100–200 | 0.00% | 11.42% | 41.10% |
| 200–300 | 0.02% | 10.08% | 106.96% |
| 300–400 | 0.05% | 18.31% | 195.60% |
| Average | 0.02% | 12.51% | 95.87% |
Real-World Impact
For logistics operators and enterprises with delivery or service fleets, these results translate directly into operational value.
The ability to reliably honor tight delivery windows leads to more on-time deliveries and fewer SLA violations, strengthening customer satisfaction, trust, and confidence in day-to-day operations.
Efficiency in planning across multi-depot networks improves fleet utilization, reduces unnecessary mileage, and lowers operating costs. High-speed optimization enables teams to react quickly to delays, traffic disruptions, and urgent orders, ensuring stable performance even in fast-changing environments.
For both operational teams and business leaders, the practical outcome is clear: lower cost per delivery, higher fleet productivity, more reliable daily operations, and stronger customer trust.
What’s Next?
Our next article will dive into a parcel-delivery case study, examining how real operational complexity affects day-to-day routing, and how TQrouting’s optimized routes translate into cost benefits, higher fleet efficiency, and measurable business value.
If you’d like to explore how TQrouting could support your last-mile operations, contact us to learn more or request a demo.
-
November 2026 Update: Closer to the Best-Known Solutions
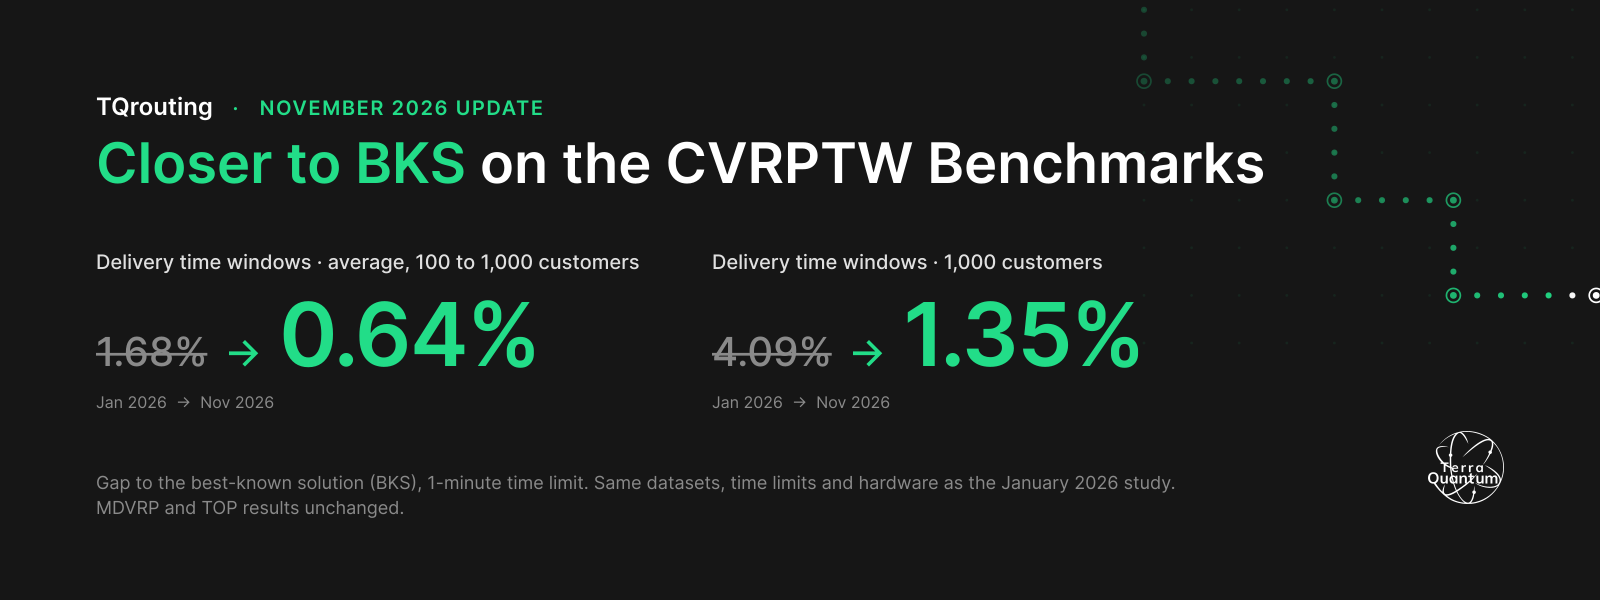
Since we published these results in January, the TQrouting solver has continued to improve, so we re-ran the time-window benchmark with the current version. Everything else stayed the same: the Solomon and Gehring & Homberger instances, the 1-minute limit per instance, default settings and the same Google Cloud VM (AMD EPYC 7B13, 16 vCPUs at 3.05 GHz, 32 GB RAM).
Time windows are part of almost every delivery operation, and they get harder to handle well as instances grow. The average gap dropped from 1.68% to 0.64%, and on the largest instances, with 1,000 customers, from 4.09% to 1.35%.
Solomon and Gehring & Homberger (CVRPTW), 100 to 1,000 customers, 1-minute limit
Average relative gap to the best-known solution, by instance size.
| Customers | TQrouting 2026 | TQrouting 2025 | OR-Tools 9.12 | Gurobi 12.0 |
|---|---|---|---|---|
| 100 | 0.01% | 0.00% | 1.74% | 6.73% |
| 200 | 0.12% | 0.12% | 5.50% | 9.45% |
| 400 | 0.50% | 1.00% | 10.92% | 24.78% |
| 600 | 0.80% | 1.95% | 12.94% | 34.89% |
| 800 | 1.08% | 2.94% | 17.70% | 204.57% |
| 1,000 | 1.35% | 4.09% | 29.28% | 623.63% |
| Average | 0.64% | 1.68% | 13.01% | 150.67% |
The larger the instance, the larger the improvement. Up to 200 customers, TQrouting was already at or near the best-known solutions. From 400 customers up, the gap is now half or less of what we reported in January.
Note: The comparison figures for OR-Tools 9.12 and Gurobi 12.0 are from the original runs described above.
Multi-depot routing (MDVRP) and Team Orienteering Problem (TOP)
The MDVRP and TOP results reported above remain current. TQrouting was already within 0.05% of the best-known solutions in every instance group on both benchmarks (average gaps of 0.022% and 0.02%).