
The Capacitated Vehicle Routing Problem (CVRP) is one of the most widely studied challenges in logistics optimization. At its core, it models the task of serving a set of customers with varying demand using a fleet of vehicles with limited capacity, while minimizing travel costs. Solving CVRP efficiently is essential for industries like parcel delivery, grocery distribution, and large-scale logistics planning.
In this article, we are focusing on evaluating how the solver performs on widely used CVRP benchmarks, demonstrating both solution quality and scalability in practice.
To test TQrouting, we benchmarked it on two widely recognized CVRP datasets: Uchoa et al. (up to 1,000 customers) and Arnold et al. (up to 30,000 customers). Together, these benchmarks set the gold standard for evaluating both solution quality and scalability in route optimization and form the backbone of academic benchmarking for VRP solvers.
- Uchoa et al. (X dataset): introduced as part of the CVRP Benchmark Library — contains structured, well-designed medium-scale instances (100–1,000 customers) that reflect typical operational routing scenarios. It is considered a de facto standard in evaluating the efficiency of general-purpose and specialized VRP algorithms.
- Arnold et al. (XL dataset): designed to push computational limits — features large-scale instances with up to 30,000 customers, enabling rigorous scalability tests for algorithms aiming for practical deployment in enterprise-scale logistics operations.
Both benchmark sets are officially maintained and recognized by the VRP academic community through the VRP Repository. They are widely used by academic researchers and solver developers, making them reliable and transparent ways to measure solver performance. Performing well on these datasets signals algorithmic strength and practical readiness for real-world deployments.
Experiment Setup
- Hardware: Google Cloud Platform VM with AMD EPYC 7B13 processor, 16 vCPUs @ 3.05 GHz, 32 GB RAM
- Solvers tested: TQrouting, Gurobi (v12.0), OR-Tools (v9.12)
- Runtime limits: Uchoa et al. dataset (up to 1,000 customers): 1 minute per instance; Arnoldet al. dataset (up to 30,000 customers): 10 and 60 minutes per instance
- Parameters: Default settings and multithreading enabled (allowing solvers to fully leverage parallelism)
- Metric: Relative gap to the best-known solution (BKS) reported in the literature
Results
Uchoa et al. dataset (up to 1,000 customers)
TQrouting achieves an average gap of 0.40% within just 1 minute, maintaining high-quality solutions across both small and large instances. Under identical runtime limits, it outperforms state-of-the-art commercial and open-source solvers.
| Customers | TQrouting | Gurobi 12.0 | OR-Tools 9.12 |
| 100-200 | 0.02% | 8.33% | 4.34% |
| 200-400 | 0.22% | 14.31% | 6.83% |
| 400-600 | 0.44% | 19.13% | 7.03% |
| 600-800 | 1.00% | 25.09% | 7.90% |
| 800-1000 | 1.03% | 31.27% | 5.48% |
| Average | 0.40% | 17.13% | 6.33% |
Arnold et al. dataset (up to 30,000 customers)
Within a 10-minute runtime limit, TQrouting achieves an average gap of 3.10%.
With 60 minutes, the gap improves further to 2.42%, demonstrating strong convergence and robustness even at massive scale.
| Instance | Customers | Capacity | TQrouting (10min) | OR-Tools 9.12 (10min) | TQrouting (60min) | OR-Tools 9.12 (60min) |
| Leuven1 | 3.000 | 25 | 1.88% | - | 2.03% | 6.29% |
| Leuven 2 | 4.000 | 150 | 4.81% | 13.18% | 4.39% | 13.17% |
| Antwerp1 | 6.000 | 30 | 1.64% | 6.09% | 1.38% | 5.42% |
| Antwerp2 | 7.000 | 100 | 2.78% | 11.90% | 2.73% | 9.83% |
| Ghent1 | 10.000 | 35 | 1.99% | - | 1.41% | 5.03% |
| Ghent2 | 11.000 | 170 | 3.72% | - | 3.00% | 10.25% |
| Brussels1 | 15.000 | 50 | 1.94% | 9.11% | 1.44% | 6.60% |
| Brussels2 | 16.000 | 150 | 3.71% | - | 2.87% | - |
| Flanders1 | 20.000 | 50 | 1.72% | 6.50% | 1.30% | 4,98% |
| Flanders2 | 30.000 | 200 | 6.82% | - | 3.62% | - |
| Average | 3.10% | 9.36% | 2.42% | 7.70% |
- Gurobi 12.0 could not find feasible solutions due to memory requirements.
- OR-Tools failed to find a feasible solution in 5/10 instances within 10 minutes of runtime and 2/10 within 60 minutes of runtime. The reported OR-Tools averages only cover feasible cases.
What These Results Mean in Practice
For large logistics networks, even a 1% efficiency gain can translate into millions in annual savings through reduced mileage, fuel costs, lower CO2 emissions, and lower personnel costs through efficient resource utilization. TQrouting goes beyond finding feasible solutions quickly. It finds better solutions within realistic runtime limits, translating into measurable business impact. This makes it a perfect fit for tackling real-world decision-making in modern logistics.
What’s Next?
These results showcase how TQrouting combines speed, quality, and scalability in solving the CVRP, the backbone of routing optimization. While this article focuses on CVRP, TQrouting is not limited to a single VRP variant. Its architecture is designed to address various constraints and settings, such as:
- time-constrained routing (CVRP-TW)
- multi-depot planning (MDVRP)
- prize-collecting variants like the Team Orienteering Problem (TOP)
- heterogeneous fleets and capacity variations
- driver shifts and route duration constraints
Upcoming articles will explore these scenarios in more detail, showing how the same core engine adapts to diverse routing challenges.
Interested in exploring TQrouting for your logistics problem? Contact us to learn more or see a demo.
-
November 2026 Update: Closer to the Best-Known Solutions
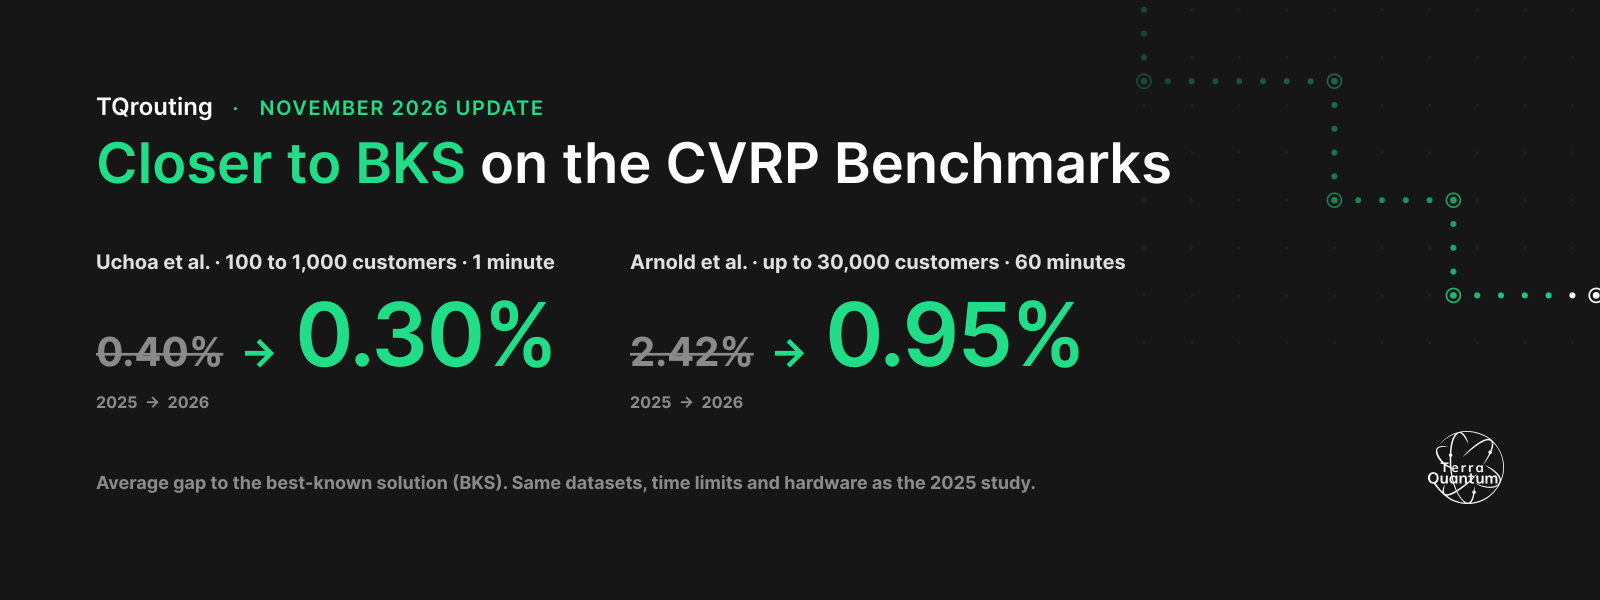
TQrouting has improved considerably since we first ran these benchmarks. To see what that means in practice, we went back to the same instances and ran them again with the current solver: same datasets, same time limits, same default settings and the same Google Cloud VM (AMD EPYC 7B13, 16 vCPUs at 3.05 GHz, 32 GB RAM).
The gaps got smaller, and the biggest improvement is on the largest instances. On the Uchoa set, the average gap to the best-known solutions dropped from 0.40% to 0.30%. On the Arnold instances, with up to 30,000 customers, it dropped from 2.42% to 0.95% with a 60-minute limit.
Note: The comparison figures for OR-Tools 9.12 and Gurobi 12.0 are from the original runs described above.
Uchoa et al., 100 to 1,000 customers, 1-minute limit
Average relative gap to the best-known solution, by instance size.
| Customers | TQrouting 2026 | TQrouting 2025 | OR-Tools 9.12 | Gurobi 12.0 |
|---|---|---|---|---|
| 100–200 | 0.04% | 0.02% | 4.34% | 8.33% |
| 200–400 | 0.28% | 0.22% | 6.83% | 14.31% |
| 400–600 | 0.35% | 0.44% | 7.03% | 19.13% |
| 600–800 | 0.53% | 1.00% | 7.90% | 25.09% |
| 800–1,000 | 0.54% | 1.03% | 5.48% | 31.27% |
| Average | 0.30% | 0.40% | 6.33% | 17.13% |
The small instances were already close to their best-known solutions, so there was little left to gain; the differences there are within normal run-to-run variation. From 600 customers up, the gap roughly halved. On these benchmarks the objective is total route distance, so a 0.54% gap means plans about half a percent longer than the best-known solution.
Arnold et al., 3,000 to 30,000 customers, 10-minute limit
Relative gap to the best-known solution, per instance.
| Instance | Customers | TQrouting 2026 | OR-Tools 9.12 |
|---|---|---|---|
| Leuven1 | 3,000 | 1.27% | No feasible solution |
| Leuven2 | 4,000 | 1.44% | 13.18% |
| Antwerp1 | 6,000 | 0.76% | 6.09% |
| Antwerp2 | 7,000 | 1.23% | 11.90% |
| Ghent1 | 10,000 | 0.77% | No feasible solution |
| Ghent2 | 11,000 | 1.87% | No feasible solution |
| Brussels1 | 15,000 | 0.67% | 9.11% |
| Brussels2 | 16,000 | 1.86% | No feasible solution |
| Flanders1 | 20,000 | 0.88% | 6.50% |
| Flanders2 | 30,000 | 2.77% | No feasible solution |
| Average | 1.35% | 9.36% (feasible cases only) |
With 10 minutes per instance, TQrouting found a feasible solution for every instance, up to 30,000 customers. OR-Tools did so on 5 of the 10, and Gurobi on none, because of its memory requirements. The current solver's 10-minute average (1.35%) is already better than what the previous version reached in 60 minutes (2.42%).
Arnold et al., 3,000 to 30,000 customers, 60-minute limit
Relative gap to the best-known solution, per instance.
| Instance | Customers | TQrouting 2026 | TQrouting 2025 | OR-Tools 9.12 |
|---|---|---|---|---|
| Leuven1 | 3,000 | 1.09% | 2.03% | 6.29% |
| Leuven2 | 4,000 | 1.48% | 4.39% | 13.17% |
| Antwerp1 | 6,000 | 0.56% | 1.38% | 5.42% |
| Antwerp2 | 7,000 | 0.59% | 2.73% | 9.83% |
| Ghent1 | 10,000 | 0.62% | 1.41% | 5.03% |
| Ghent2 | 11,000 | 1.22% | 3.00% | 10.25% |
| Brussels1 | 15,000 | 0.35% | 1.44% | 6.60% |
| Brussels2 | 16,000 | 1.06% | 2.87% | No feasible solution |
| Flanders1 | 20,000 | 0.59% | 1.30% | 4.98% |
| Flanders2 | 30,000 | 1.97% | 3.62% | No feasible solution |
| Average | 0.95% | 2.42% | 7.70% (feasible cases only) |
Given 60 minutes, the average gap dropped to 0.95%, and every instance improved on its earlier result. Even the largest instance, Flanders2 with 30,000 customers, is now within 2% of the best-known solution.
The time limit is a setting, not a fixed property of the solver. A shorter limit fits tight planning windows; a longer one makes sense when there is time to plan ahead, such as overnight for next-day routes. Either way, quality now holds up much better as the instance grows.